Oracle Apex Interactive Report with rowspan
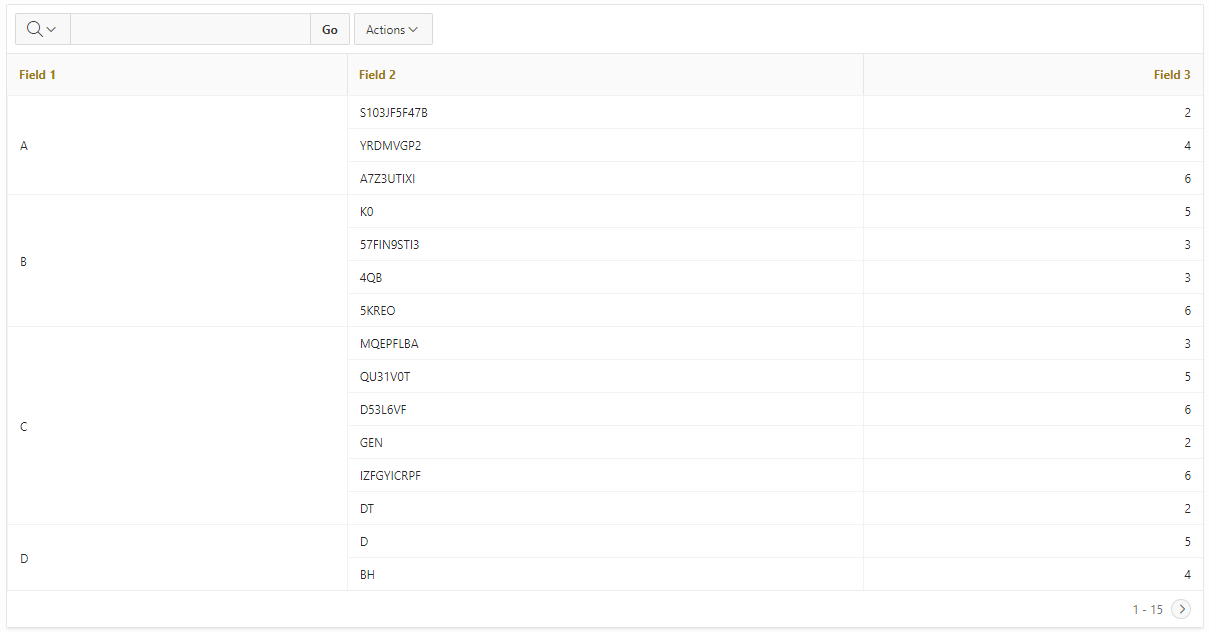
Let’s take a look on the resulting Interactive Report (IR). Grouping is done on Field 1.
Setup a IR with the following sample query:
with SAMPLE_QUERY as (
   select DBMS_RANDOM.STRING('U', 1) FIELD_1
        , DBMS_RANDOM.STRING('X', TRUNC(DBMS_RANDOM.VALUE(1, 12))) FIELD_2
        , TRUNC(DBMS_RANDOM.VALUE(1, 7)) FIELD_3
     from DUAL connect by LEVEL < 101)
select FIELD_1
     , FIELD_2
     , FIELD_3
     , row_number() over (partition by FIELD_1 order by FIELD_1) as RN
     , count(*) over (partition by FIELD_1 order by FIELD_1) as TR
  from SAMPLE_QUERY
The important parts are the analytic functions in line #9 for the line row number (RN) and in #10 for the total lines per group (TR) as we will see in the jQuery part. When running the query, the result might look like this:
FIELD_1    FIELD_2                 FIELD_3         RN         TR
---------- -------------------- ---------- ---------- ----------
A          47YJ5R9S3N                    5          1          2
A          APRG                          5          2          2
B          SGD9QYZ7KB                    6          1          4
B          Z                             3          2          4
B          QGEFZE                        2          3          4
B          KAEL                          4          4          4
C          OSONEVXHYC                    2          1          3
C          42KVNEXZKSE                   6          2          3
C          VC                            3          3          3
D          6XLYT663                      3          1          4
D          Y30JQ0A7QIF                   6          2          4
...
After setting up the query add a HTML Expression in the Column Formatting section of column FIELD_1:
<span class="ir-rowspan" data-rn="#RN#" data-tr="#TR#">#FIELD_1#</span>
With this markup we have everything setup for the JavaScript part. Run this code after PAGE LOAD and AFTER REFRESH with a dynamic action
apex.jQuery('.ir-rowspan').each(function () {
  if (apex.jQuery(this).attr('data-rn') === '1') {
    apex.jQuery(this).parent('td').attr('rowspan', apex.jQuery(this).attr('data-tr'));
  } else {
    apex.jQuery(this).parent('td').remove();
  }
})
Or put the following code in a JavaScript file and run only the function rowSpan.init(); on page load
var rowSpan = rowSpan || [];

rowSpan = function () {
    apex.jQuery('.ir-rowspan').each(function () {
        if (apex.jQuery(this).attr('data-rn') === '1') {
            apex.jQuery(this).parent('td').attr('rowspan', apex.jQuery(this).attr('data-tr'));
        } else {
            apex.jQuery(this).parent('td').remove();
        }
    })
}
rowSpan.init = function () {
    // Run after ui elements rendered on page
    apex.jQuery(window).on('theme42ready', function () {
        rowSpan();
    })

    // Run after refresh of report
    apex.jQuery(document).on('apexafterrefresh', function () {
        rowSpan();
    })
}
If the grouped column is the first one in an IR this class has to be set, too. Else the border isn’t shown correctly.
.a-IRR-table tr td:first-child {
    border-left-width: 1px;
}